Browse Cache Statistics
Pre-Requisite
Make sure NCache Service is started. If it is not started, do the following:
In PowerShell, enter the following command:
Start-Service -Name NCacheSvc
For .NET Core, make sure that you run NCache service as an administrator. Here are the steps to do so:
- Open Services window and look for NCache in the list.
- Right click on NCacheSvc from the list and choose Properties.
- Go to the Log On tab and click on the Browse button.
- In the object name field, type Administrator and click on the Check Names button.
- It will pick the appropriate Administrator, then click OK.
- Now, set a Password and click OK.
- Right click on the NCache service and choose the Restart option. Now your service will start running as administrator.
NCache Web Manager
Launch NCache Web Manager by browsing to
http://localhost:8251(Windows) or<server-ip>:8251(Windows + Linux).In the left navigation bar, click on Local Caches or Clustered Caches based on your requirement. This opens up a new page at
<server-ip>:8251/. The page shows any existing local or clustered caches and additional details like Server and Server Platform.

Select the cache and check the checkbox against the cache name.
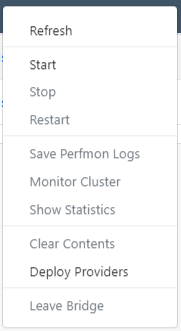
Method 1: Click on the "..." button against the cache name. Click on Show statistics from the options.

Mathod 2: Click on the
 from the toolbar.
A statistic window will pop open showing the cache statistics.
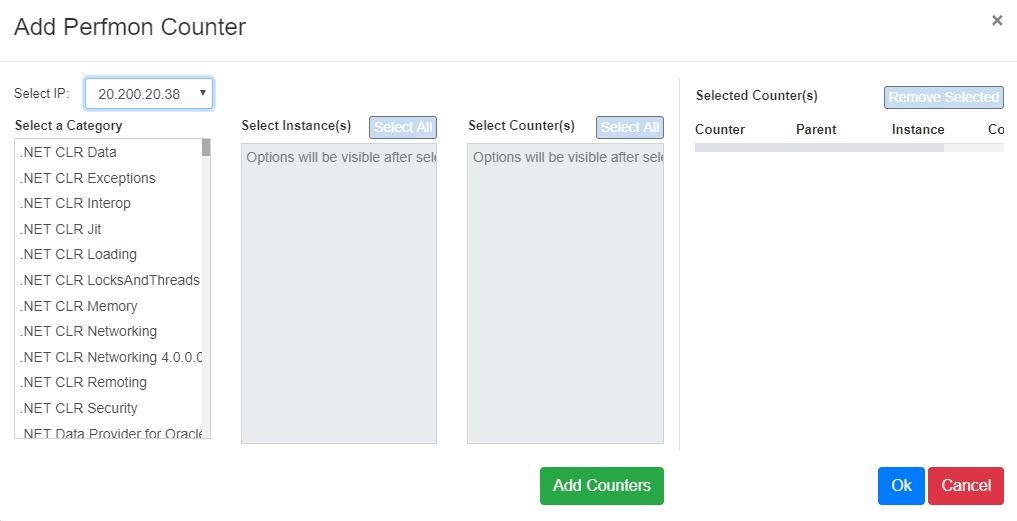
- In order to add counters for monitoring, click on the + sign against Performance Counters on the top of the page.

- From the category list select NCache. It shows all the present caches on the server node provided.
- Select the instance of the cache that needs to be monitored. A list of counters are displayed.
- Select the counters from the list and click on on
. It shows a list of selected counters.
- Selected counters can then be added by clicking
.
See Also
Monitor Cluster Connectivity
Monitor Cache Clusters using NCache Email Alerts