Monitor Caches in NCache Web Monitor
Both local and clustered caches publish performance statistics using Windows Performance Counters. NCache also publishes performance statistics of cache from client perspective. In this step, you will verify that the Stress test tool that you ran in previous step is making cache calls successfully.
By default, NCache Web Management Process is running on your local server node with port 8251. If not running, NCache Web Manager will auto-start by default upon starting NCacheSvc.
There are two major categories of performance counters: Server counters and Client counters.
Pre-requisites
Have a look at supported browsers and other configurations for Web Manager here.
For .NET, make sure NCache Service (NCacheSvc) is started. If it is not started, type the following command in PowerShell (run as admin):
Start-Service -Name NCacheSvc
- For .NET Core, run NCache Service (NCacheSvc) as Administrator. Please refer to this section for detail.
Using NCache Web Monitor
Launch NCache Web Manager by browsing to
http://localhost:8251(Windows) or<server-ip>:8251(Windows + Linux).From the left navigation bar, click on the Clustered Caches or Local Caches based on your requirement.

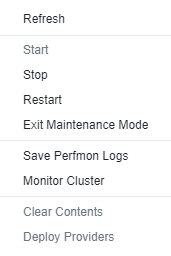
- Click on the "..." button on the right corner against the cache name and click on Monitor Cluster. Make sure that the cache is already running.

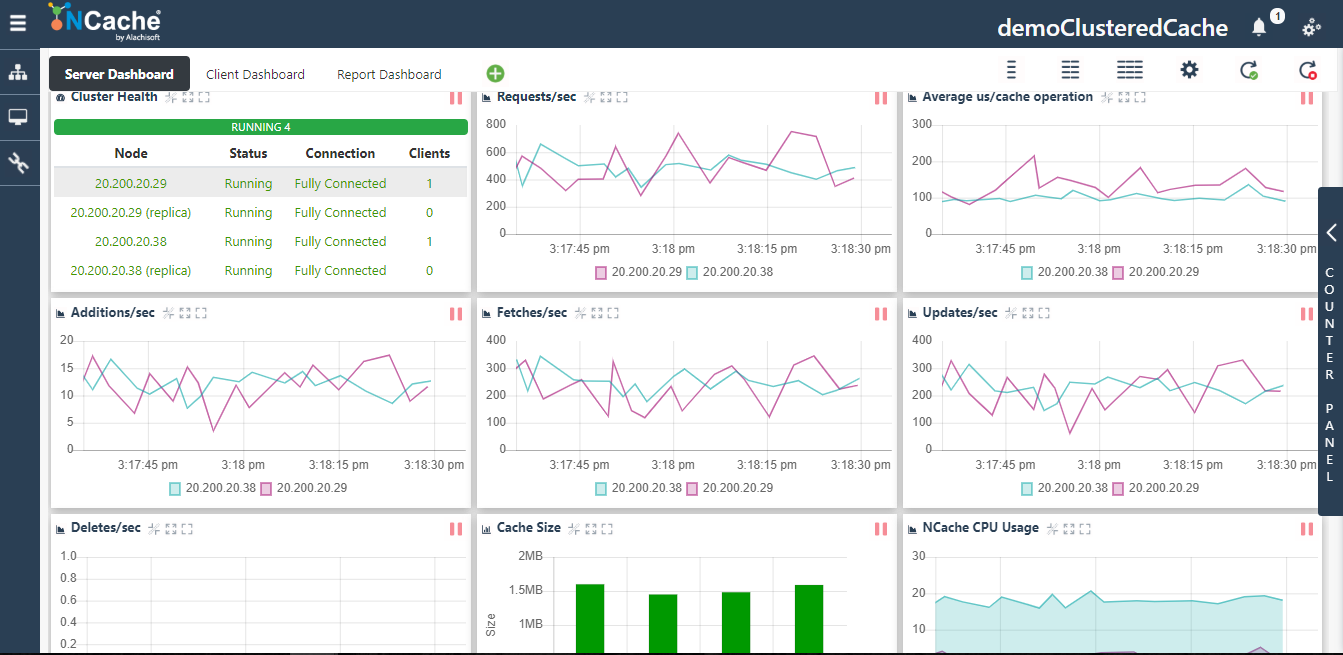
- A new tab will open the NCache Monitor. By default, NCache Monitor displays selected counters in Server Dashboard and Report-View Dashboard form. Granted that the
Test-Stresstool is running, you will be able to monitor statistics for each server:

See Also
Create a Cache
Simulate Cache Usage
Use NCache from .NET Application
Use NCache for ASP.NET Sessions