Monitoring Operations on Cache Cluster
NCache publishes different performance counters, provides logging for caches, cache clients, and email notifications for clustered caches. Using these options, you can monitor the caches.
Run Test-Stress Cmdlet
To monitor the cache cluster, follow these steps:
Deploy a machine/instance in the same resource Group/VPC in which your servers are running.
Configure NCache client on your deployed machines by installing PowerShell Module on it. Follow the Install PowerShell Module without NCache Installation guide for reference.
When done, run the
Test-StressPowerShell cmdlet on it.Test-Stresscmdlet simulates heavy transactional load on a specified cache to monitor NCache performance under stress in a given environment.
To run Test-Stress tool inside your client machine, follow these steps:
From Start, open Windows PowerShell.
Execute the following command in the PowerShell window with your cache cluster name.
Test-Stress -CacheName demoClusteredCache
To understand more about the Test-Stress cmdlet, refer to Test-Stress Cmdlet.
Monitor Cache Cluster
Note
NCache Web Monitor is only available in Enterprise Edition.
NCache provides built-in monitoring and statistics dashboards that show the performance of your cluster using various server and client counters.
Monitor Cache Cluster Activity through NCache Web Monitor
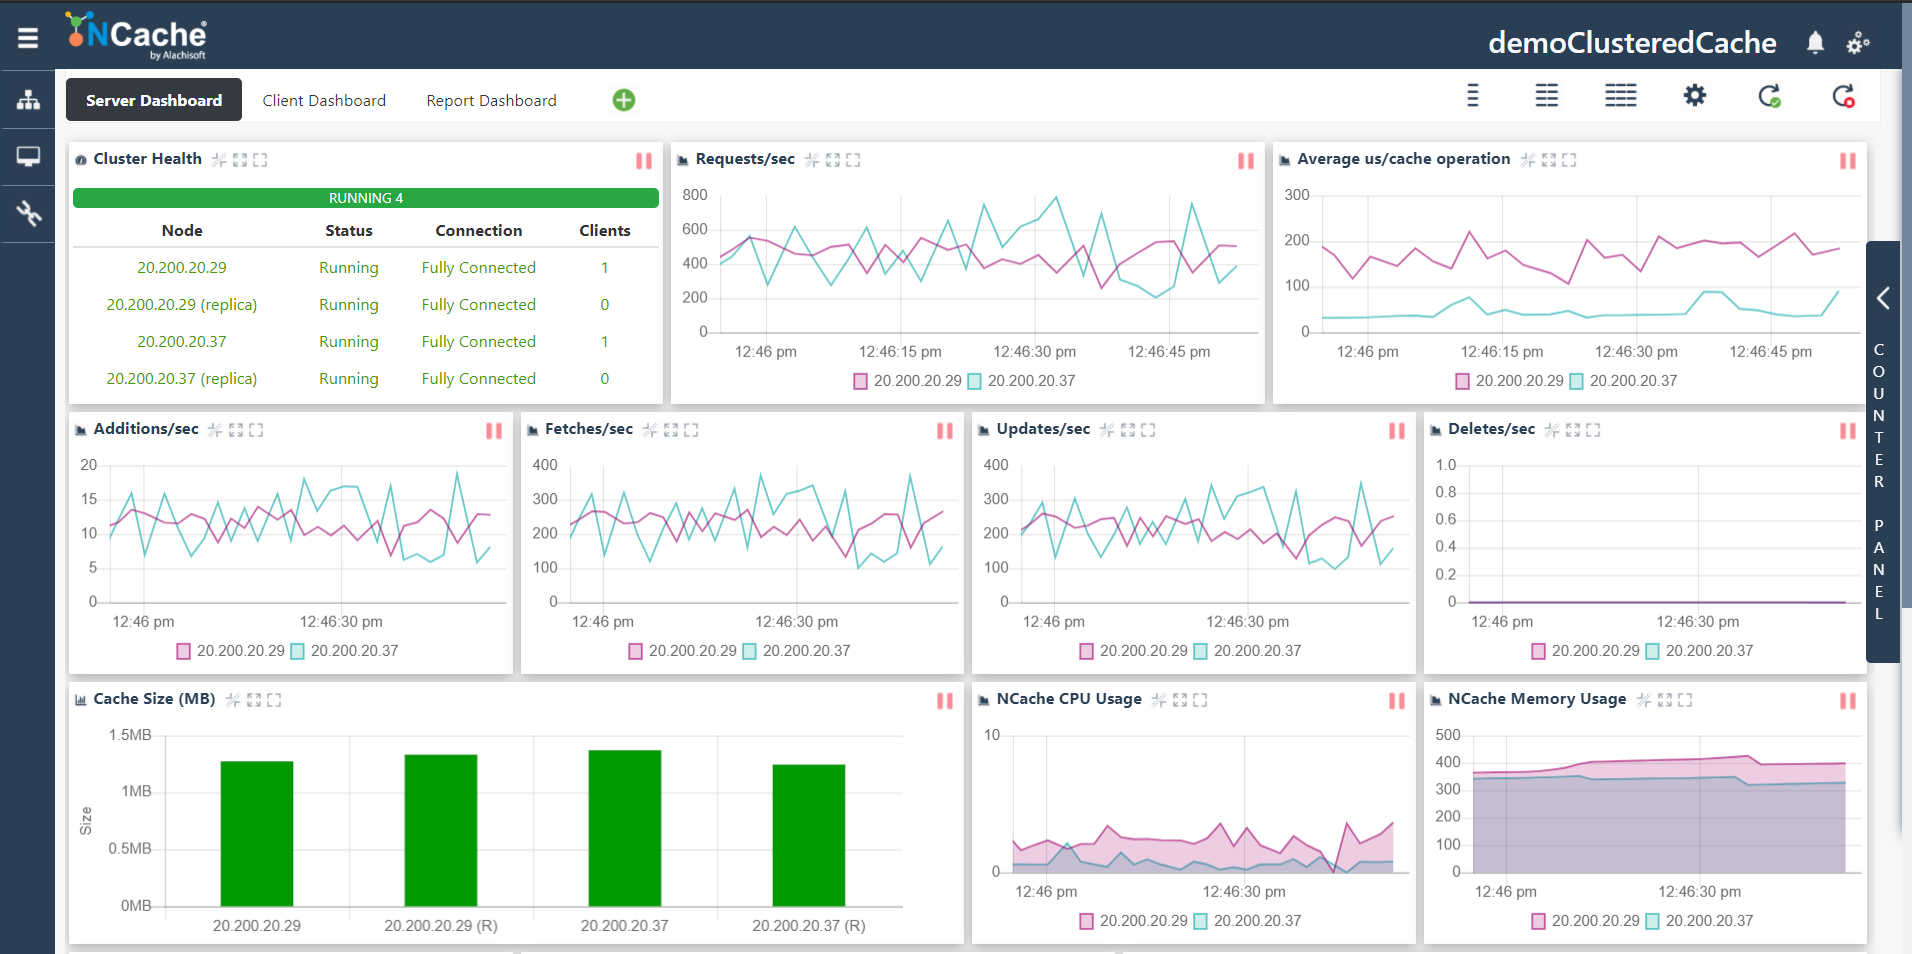
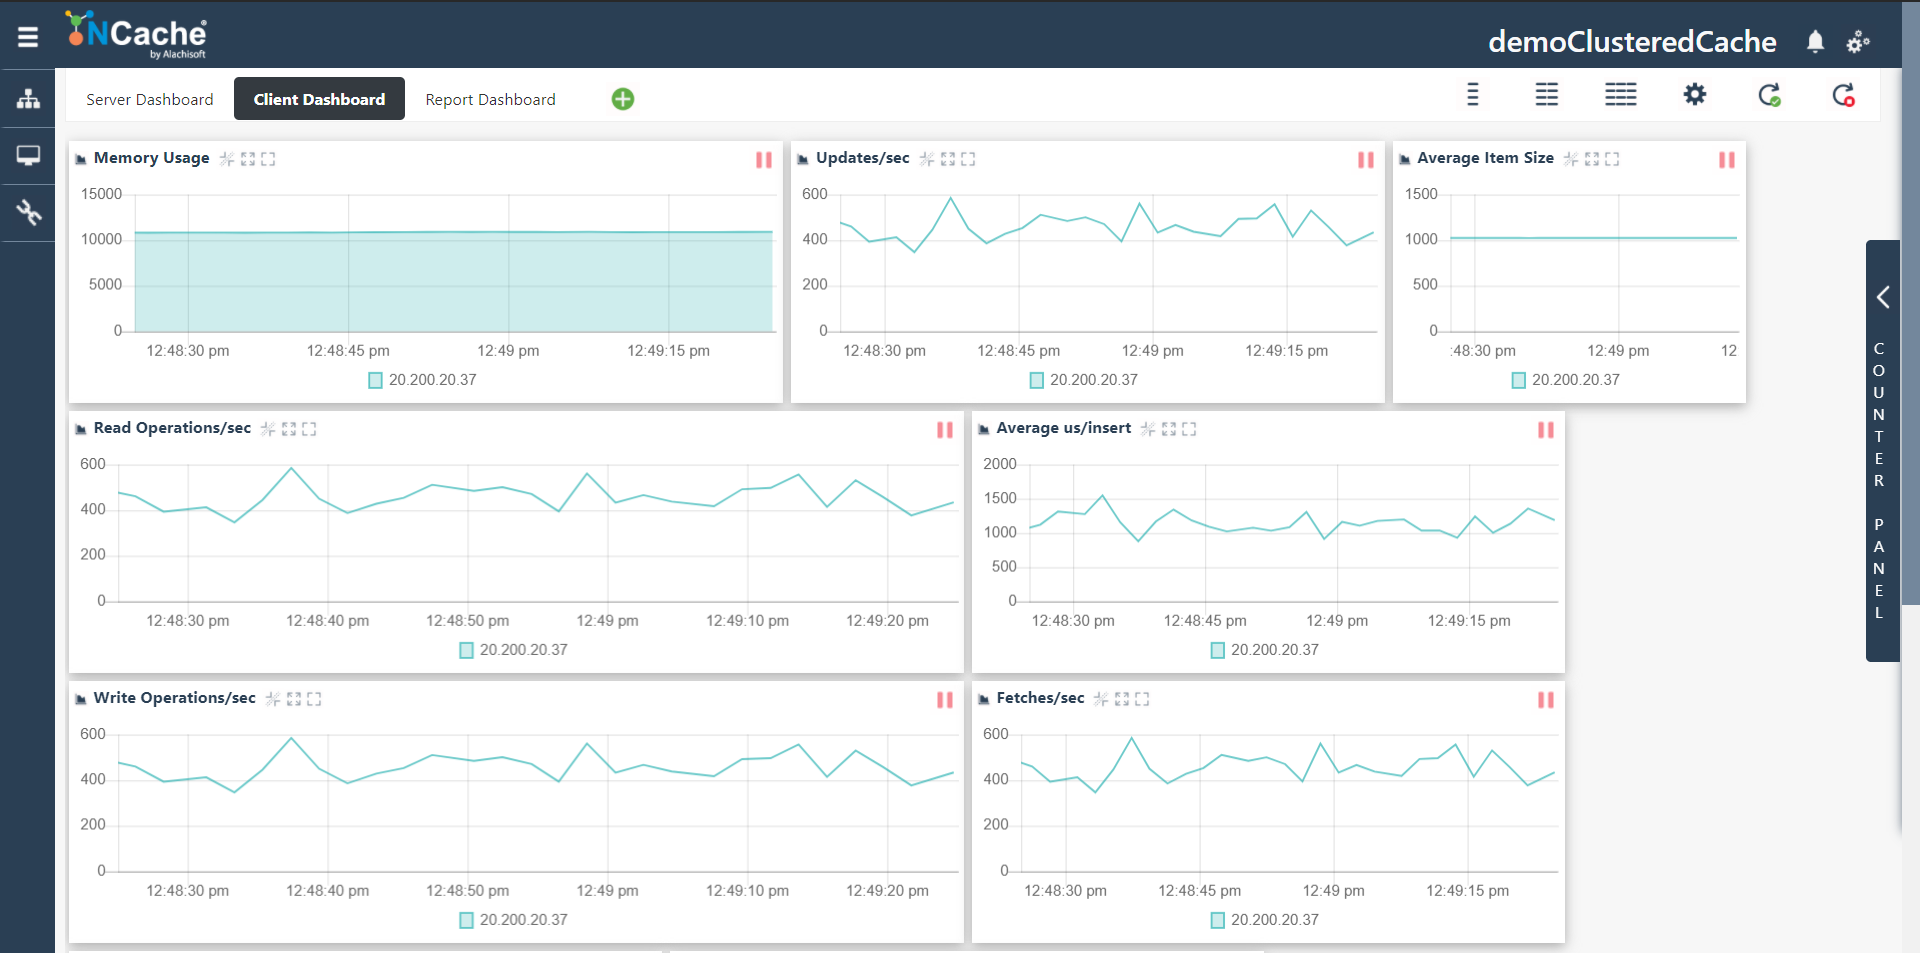
NCache Web Monitor comprises of two main dashboards: Server Dashboard and Client Dashboard.
The Server Dashboard contains Cluster Health, Event Logs, CPU Usage, Network Usage, Cache Size, Requests/sec, and Memory Usage.
You can view Server Dashboard by following the steps shown here Monitor with NCache Web Monitor.

The Client Dashboard contains counters like NCache Client CPU, NCache Client Memory, NCache Client Network, NCache Client Request Queue, NCache Client Read Operations/sec, and NCache Client Write Operations.
You can view the Client Dashboard from the tab next to Server Dashboard on NCache Web Monitor.

Monitor Cache Cluster Activity through Cache Statistics
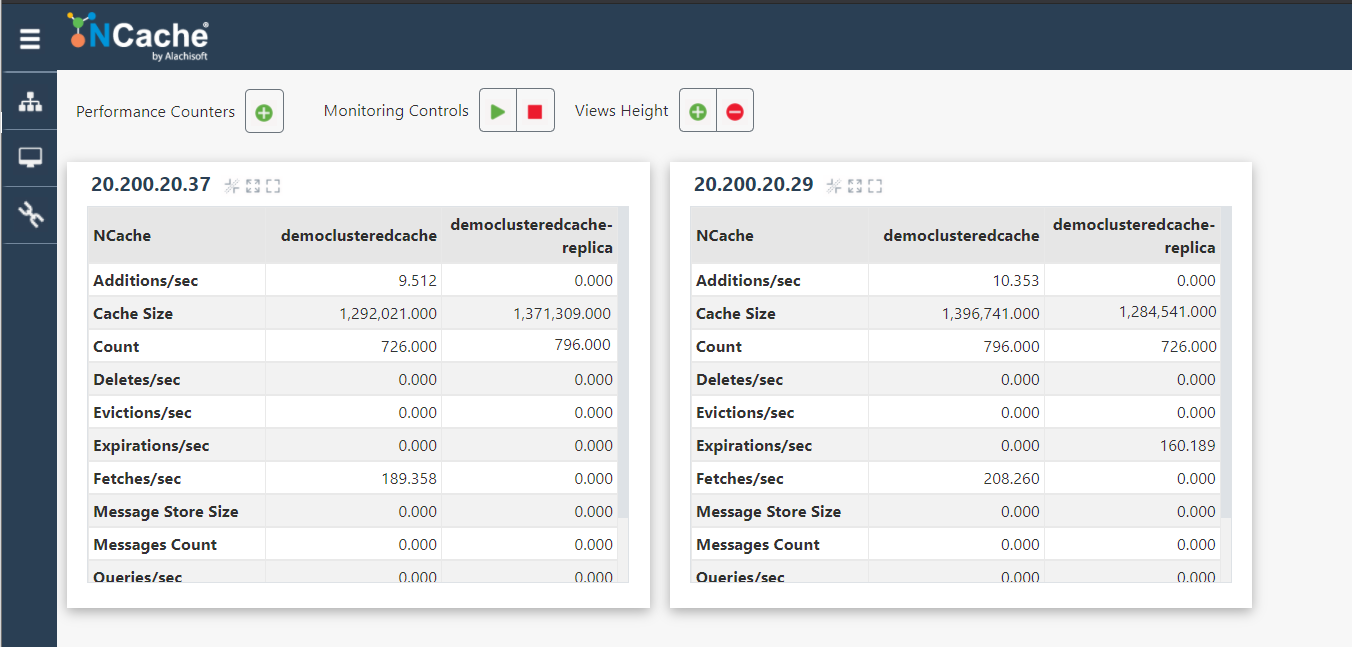
To view detailed cache cluster activity, NCache provides Cache Statistics option that updates all server and client counters at runtime. To browse Cache Statistics to monitor your newly created cache cluster's activity, follow the help on Browse Cache Statistics.

To view cache server statistics through PowerShell cmdlet, refer to our guide on Get-CacheServerStatistics and to understand how to view cache client statistics using PowerShell, see Get-CacheClientStatistics.
See Also
Monitor Using NCache Web Manager
Monitor Using Web Monitor
Monitor Using PerfMon Tool