Monitor Cache Server Counters through PerfMon Tools
Cache server counters in PerfMon are pubished by NCache under the category NCache. This category holds all the counters that are related to the cache server. In order to monitor the NCache counters through PerfMon tool, follow these steps:
Click on the Windows Start Menu or press WINDOWS + R hotkeys and search for PerfMon tool by typing PerfMon.
When the PerfMon tool opens up, go under Monitoring Tools and click on Performance Monitor.
To remove all the default counters that have already been added in the list, click the (X) button. Now, to add new counters, click on the (+) sign. This opens an Add Counters dialog box.
Find NCache category by scrolling the vertical slider bar of the available counters list.
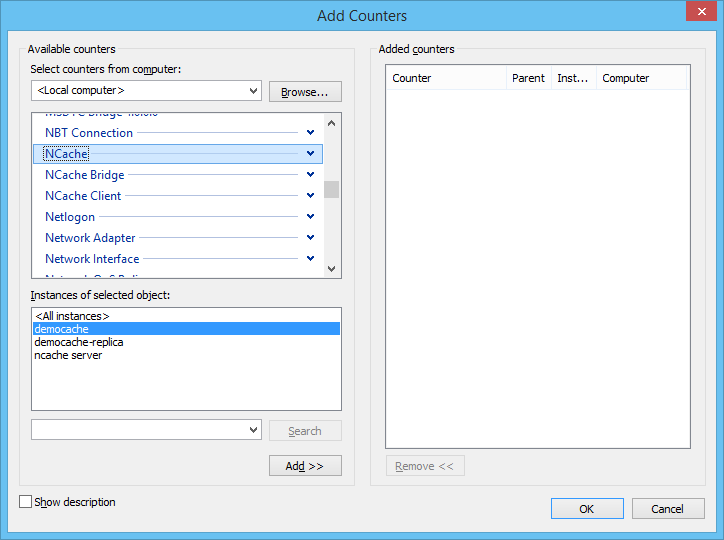
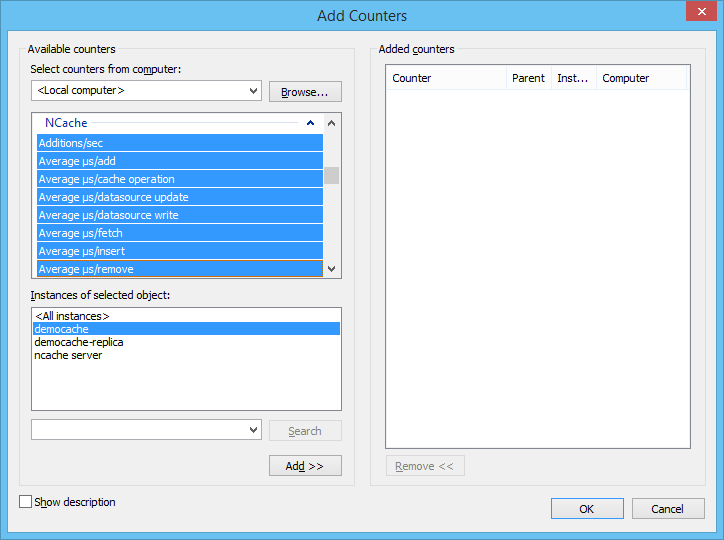
To expand the NCache category, click on the down arrowhead icon. You will see all the counters lister under it. Select the desired counters from the list displayed there.
You will find all of the currently running caches and their replica nodes listed inside the Instance of selected objects list box.
Select the instances that are required or click the < All instances> option to select all instances. Click the Add > >* button.
You will find all the selected counters listed in the Added Counters list box on the right side of the screen.
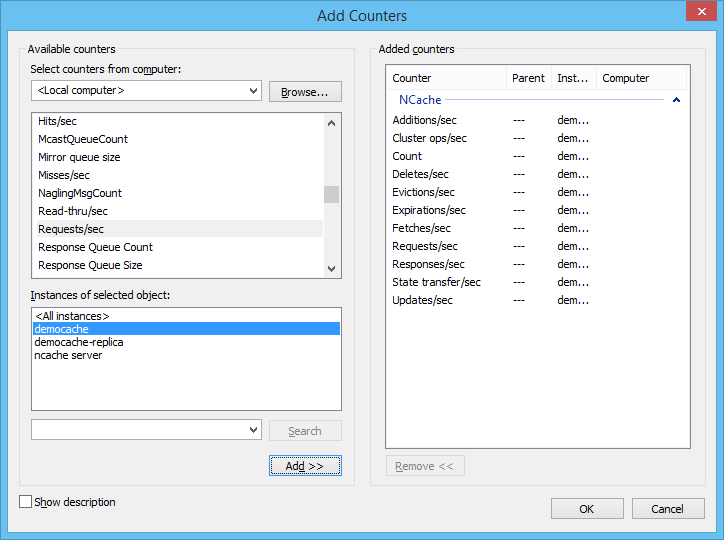
Click OK to add all added counters in the PerfMon tool. The Performance Monitor will look like this
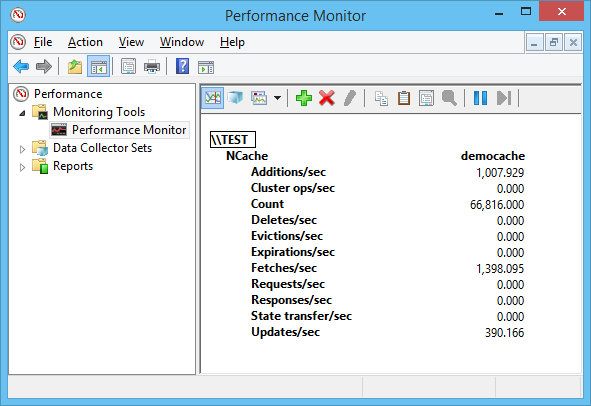
To change the PerfMon view from Report to Line, follow the steps mentioned below.
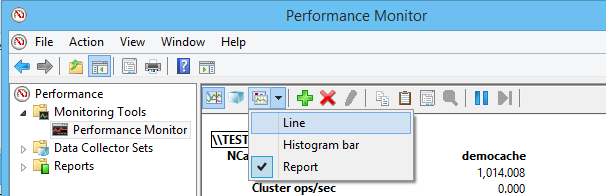
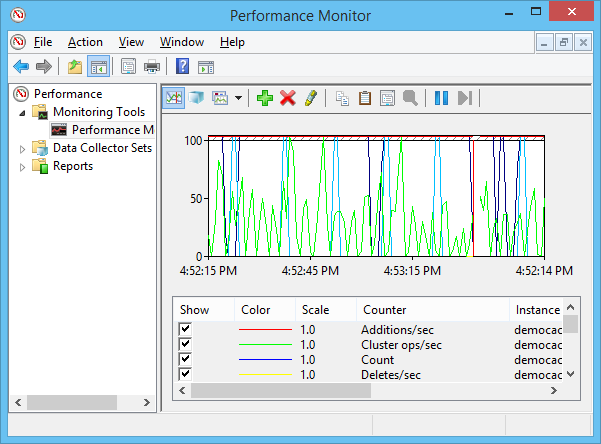
From the drop down menu, click on the Line option. This will change the PerfMon view from Report to Line. Line view shows the counters values in the form of a continuous graph as shown below.
See Also
Monitor Cache Client Counters
TroubleShooting
Test-Stress Cache
PerfMon Counters