When running an e-business, delivering a seamless user experience is essential to maintaining customer satisfaction and engagement. To achieve this, it’s essential to ensure your system can handle increasing traffic efficiently and adapt to evolving demands without compromising performance. This is where distributed caching comes into play, boosting performance and scalability. NCache is such a distributed caching solution. This in-memory platform enhances application performance by reducing database load and speeding up retrieval.
Let’s imagine your business relies on NCache to achieve these performance goals. To keep your cache running smoothly and efficiently, monitoring becomes essential. NCache supports monitoring with built-in NCache Monitor Dashboards or Custom Dashboards. Similarly with the support for PerfMon on Windows and SNMP on Linux. However, for platform independent monitoring, NCache also supports the trending open-source solutions: Prometheus and Grafana. This integration offers a more advanced, platform-independent way to monitor and manage your cache.
Rich Set of Tools for Monitoring NCache
NCache provides multiple ways to monitor your cache clusters, including client servers and bridge caches through the counters published by NCache. To monitor your statistics on a single platform, NCache provides the following tools:
- Prometheus for data storage: Prometheus is a monitoring system that efficiently collects time series data and supports modern alerting, offering an easy way to view cumulative cache statistics.
- Monitoring with Grafana: Grafana is a multi-platform monitoring GUI tool that uses a Prometheus server as its data source. It pulls metrics from the NCache cluster, collects the data, and visually displays it in an intuitive dashboard.
How to Monitor NCache Using Prometheus
Monitoring NCache using Prometheus has the three following components:
- Metrics Publisher: The metrics publisher is responsible for fetching and collecting statistics from all metric sources such as cache servers, client servers, and bridge caches. These metrics are exposed at the node level and published to the NCache Service at specified intervals.
- Prometheus Agent: The Prometheus agent (or Metrics agent) fetches metrics from the NCache Service on each node. If you have enabled metrics publishing, you can view the detailed metrics of a node with the NCache Service running on it using its IP and the default port set to where the agent runs.
- Prometheus Server: The Prometheus server provides a platform to view the cache and bridge statistics. It runs on port 9090 and can be downloaded from the official Prometheus site.
To configure monitoring using Prometheus, the following steps should be taken accordingly.
1. Configure NCache Service Config
The %NCHOME%\bin\service\Alachisoft.NCache.Service.exe.config file shipped with NCache allows you to enable or disable the cache monitoring on Prometheus through the following configuration tags as follows:
You can also make the following additional configurations in the NCache service configuration file:
For details on these tags, refer to the section in the NCache Administrators Guide.
After saving the configuration file, restart the NCache Service and the NCache Bridge Service. Ensure you restart the cache host process and all client applications on both server and client machines for the changes to take effect.
2. Configure Prometheus Config File
For monitoring NCache using Prometheus, you have to populate the prometheus.yml file shipped with the Prometheus server. Assuming that you have downloaded and extracted Prometheus on your machine, you have to set certain variables according to your requirements as discussed below:
- scrape_interval: The time interval used to define how frequently the Prometheus server pulls metrics from the Prometheus agent.
- job_name: This distinguishes multiple targets.
- targets: This sets up the agent’s address.
Your file will look as below:
After setting all these variables, save your yml file. For more details on these variables, refer to the Monitoring with Prometheus documentation.
3. Run the Prometheus Application for Cache Monitoring
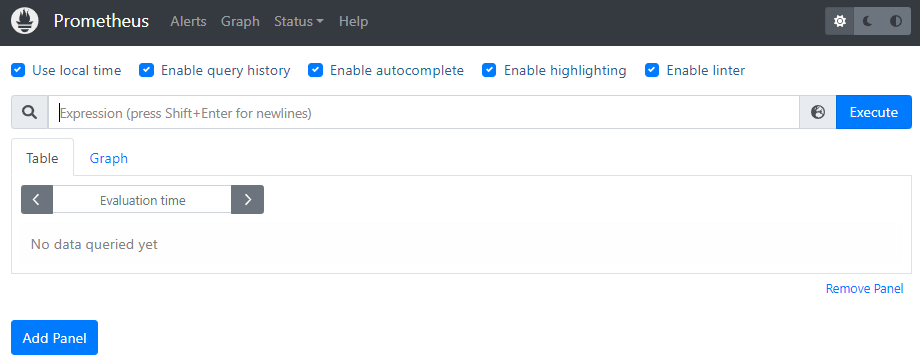
The Prometheus server runs at the default port 9090 which is shown below.

Figure 1: Prometheus Server
4. Monitor Counters with Prometheus
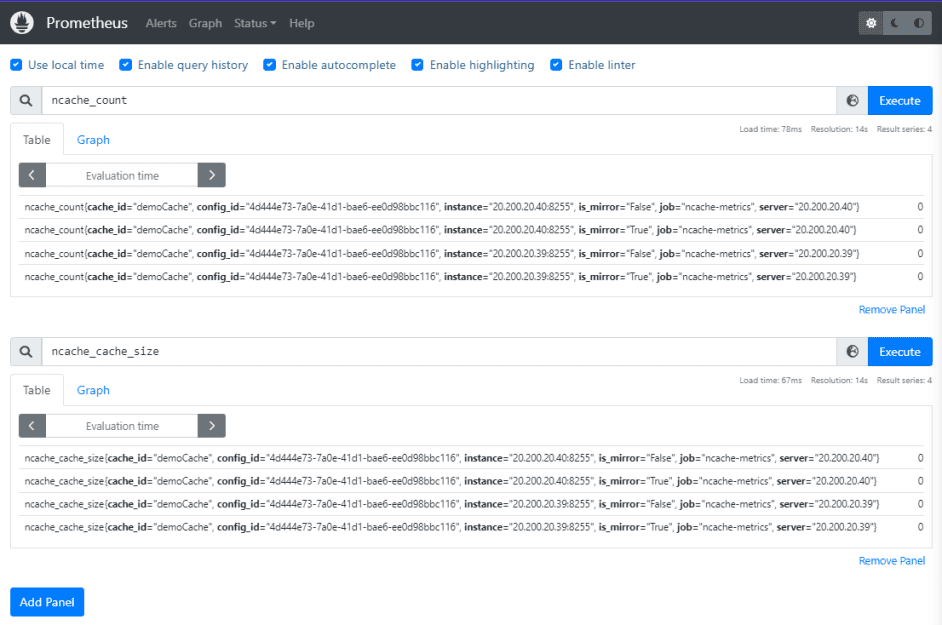
After successful server execution, you can search for the counters that you want to monitor from the search bar and add them to the panel by running the query. Prometheus will fetch all the instances of that counter from all the targets specified in the yml file.
Shown below are multiple cache counters being displayed along with multiple panels.

Figure 2: Multiple Cache Counters on Prometheus
How to Monitor NCache Using Grafana
NCache also supports the integration with Grafana’s GUI application which collects and displays metrics data from your NCache cache cluster. To use Grafana, you have to configure monitoring NCache using Prometheus, as Grafana collects metrics published on the Prometheus server.
1. Prerequisites
To use Grafana with NCache, first configure NCache monitoring with Prometheus. Ensure the NCache Service is running and your caches are active. Update the %NCHOME%\config\monitoring.ncconf file on Windows or /opt/ncache/config/monitoring.ncconf on Linux to enable counters relevant to your setup. To learn about the Counters, please refer to the NCache Documentation.
2. Setting up the Grafana Application
Next, for installation details on how to set up Grafana, refer to the Grafana Getting Started Guide. Install the Grafana application on the machine from where you want to monitor your NCache server.
3. Add Prometheus as a Data Source
As stated earlier, Grafana uses counters published on the Prometheus agent as input data, which is why it is necessary to add Prometheus as Grafana’s default data source. To add Prometheus as a default data source, follow the Add Data Source Guide.
4. Create a Dashboard for NCache Monitoring
Now, you need to start creating monitoring dashboards with multiple panels showing the NCache counters. You can create dashboards by the two methods stated below.
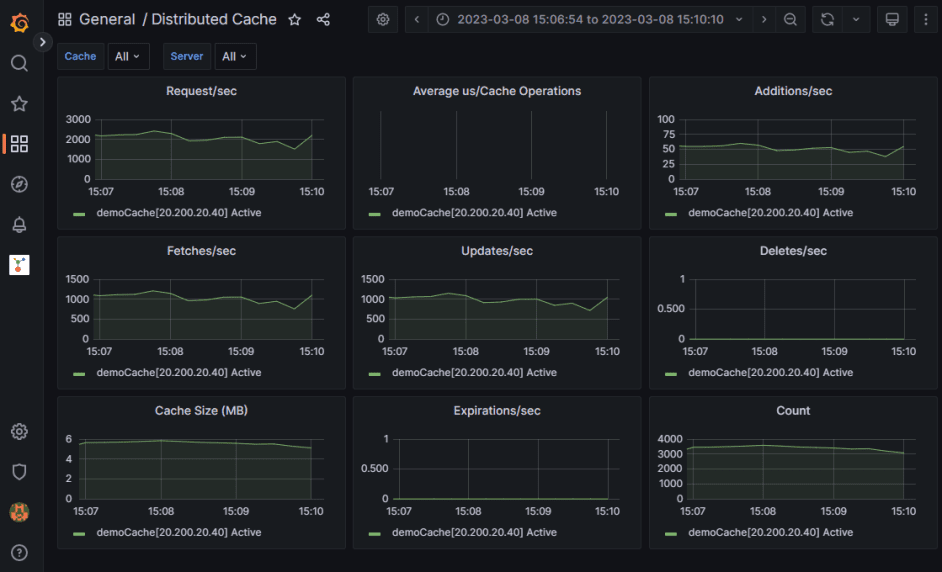
- Through the NCache Plugin: This includes 6 major dashboards such as the Cache Dashboard for showing cache server counters, the Client Dashboard for client cache counters, and the Bridge Dashboard for bridge and bridge cache counters. Similarly, you have Distributed Cache with Persistence Dashboard for Persistence Dashboard Counters and Distributed Lucene with Persistence Dashboard for Lucene Counters. These pre-configured dashboards can be added by going to the Grafana marketplace and searching for NCache. An NCache application will be shown which holds these pre-configured dashboards and you can add them accordingly.

Figure 3: NCache Plugin Cache Dashboard to monitor cache servers
For other dashboards, and to learn how to configure the NCache plugin in your Grafana application, please refer to the Grafana Documentation.
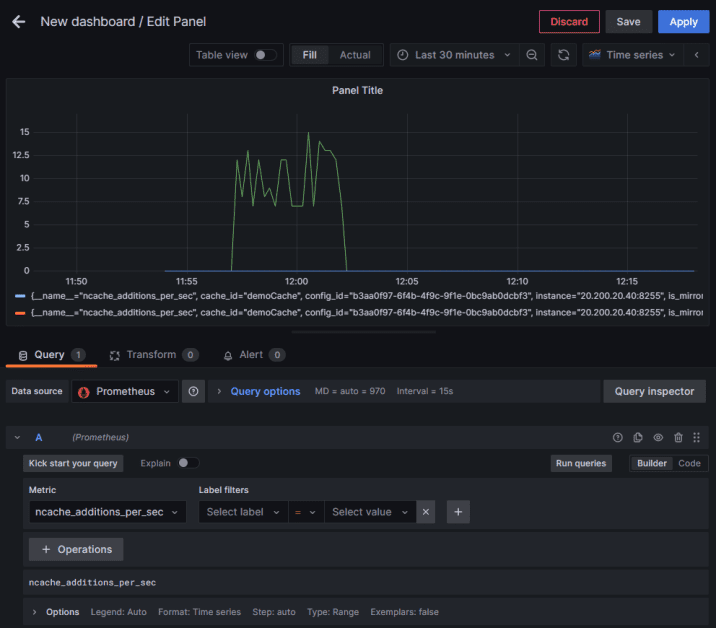
- Create Custom Dashboard: You can also create your custom dashboard by creating a dashboard and then adding a panel to it. Next, under the Metrics section, select ncache which will show you the list of metrics collected from the Prometheus server as shown below.

Figure 4: List of Metrics Collected from Prometheus Sever
Conclusion
With its integration of Prometheus and Grafana, NCache offers a robust and user-friendly solution for comprehensive, real-time monitoring, ensuring that your cache infrastructure remains efficient and responsive. You can experience this and more by downloading NCache today!


