The need for keeping a check on things or to simply put it, monitoring things is essential. This isn’t limited to just computers or software but can be applied to any kind of situation. For example, a guard can’t monitor a five-story building by himself easily, but with the help of CCTV cameras, he can.
The Problem of Monitoring a Distributed Environment
In the case of a distributed environment where an application is deployed across multiple servers, monitoring is essential. But monitoring the application and the servers locally becomes more and more difficult till it becomes almost impossible with the addition of new servers.
The same can be applied to a distributed cache cluster, which means there will be many cache nodes. This cluster can be easily monitored, if done so remotely. This is easily achieved via NCache.
NCache Web Manager NCache PowerShell Tool NCache Web Monitor
Monitoring Your Cache Cluster Remotely with NCache
Remote cache clusters can be monitored easily with the tools provided by NCache. You don’t even need NCache to be installed on your systems in order to perform remote monitoring of cache clusters. This is done via the NCache Web Monitor and the Windows PowerShell.
The NCache Web Monitor is a web-based interactive tool that can run on your internet browser. You can access the NCache Web Monitor through the NCache Web Manager. The NCache Web Manager runs on the port 8251. There you will find the option to access the NCache Web Monitor via the Monitor button. This button is enabled once you select a cache cluster you wish to monitor.
NCache also provides integration with Windows PowerShell to easily automate its administrative process. This can be accessed by running the PowerShell and then issuing the supported commands. Both of these tools (NCache Web Monitor and Windows PowerShell) are very robust. Using them you can monitor your cache clusters, individual cache nodes, and their respective resources both locally and remotely.
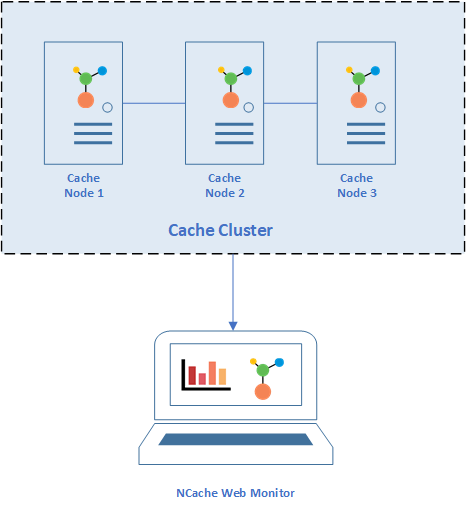
Figure 1: Remote monitoring with the NCache Web Monitor
NCache Web Manager NCache PowerShell Tool NCache Web Monitor
One Window Monitoring
You can monitor cache clusters and their nodes from a single web window remotely and locally using the NCache Web Monitor. It doesn’t matter how big the cache cluster is, the monitoring can be done from a single window which makes it all the more convenient.
The NCache Web Monitor gives you the option to monitor various statistics of the cache cluster in the form of graphs and charts. The NCache Web Monitor provides you with three dashboards to choose from namely the,
- Server Dashboard: Shows you the statistics in graphical form originating from the server end.
- Client Dashboard: Shows you the statistics in graphical form originating from the client end.
- Report Dashboard: Shows you statistics in tabular form for both the server end and client end.
The NCache Web Monitor also gives you the option to add your own custom dashboard.
The following statistics are displayed to the user in the NCache Web Monitor,
- Health of the cache cluster
- Requests per second on the cache cluster
- CPU usage of the cache cluster and client
- Memory usage of the cache cluster and client
- NCache Event Logs and much more
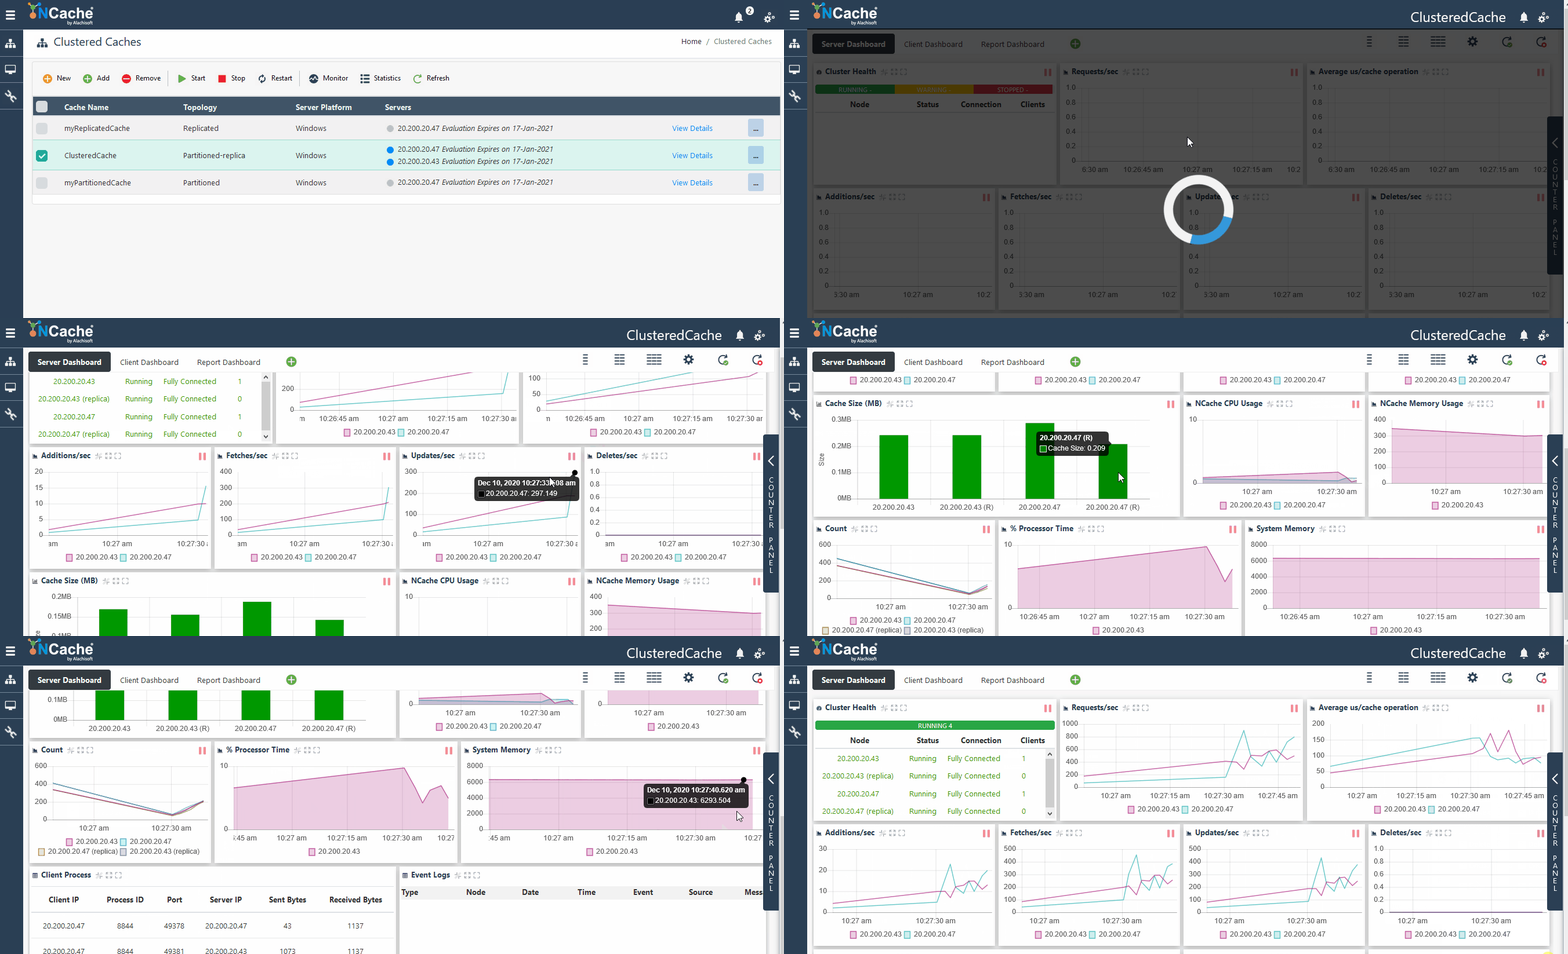
Figure 2: Remote monitoring with the NCache Web Monitor
Cache Counters NCache Web Management Monitor Caches
NCache PerfMon Counters
Performance Monitor (PerfMon) is a tool that comes built-in with Windows and allows you to look into the performance of your system and the applications that are running on it. Cache cluster performance can be monitored using this tool as well, because NCache provides numerous counters to Windows Performance Monitor. The best part is that you can perform remote monitoring as well by entering the IP address of the remote machine while adding counters to monitor.
The following are some of the counters provided by NCache for the client and server side for monitoring latency.
- Average μs/add
- Average μs/addbulk
- Average μs/remove
- Average μs/insertbulk and much more.
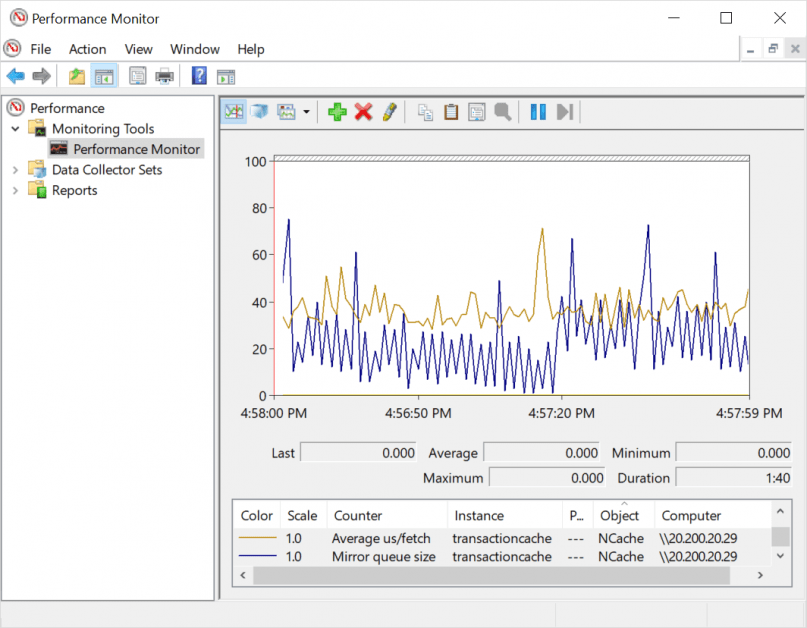
Figure 3: Monitoring cache cluster with Windows PerfMon
Monitor Cache Using Web Manager Monitor Caches Monitor Cache with PerfMon Tool
Remote Monitoring of the Cache Cluster with Windows PowerShell
The PowerShell is available for Linux, Mac, and Windows, this makes it very versatile. There are scenarios where the OS that is being used doesn’t support a GUI. In these kinds of scenarios, the NCache Web Monitor becomes unusable. That is where Windows PowerShell becomes your first choice. This is because it can be used in both GUI and non-GUI based operating systems.
Using Windows PowerShell, you can monitor and manage cache clusters remotely with ease by issuing the supported commands. For the supported commands you can go to PowerShell reference. The results returned to you on the issuing of these commands will be in textual form.
This figure shows how you can monitor your cache cluster health with Windows PowerShell.
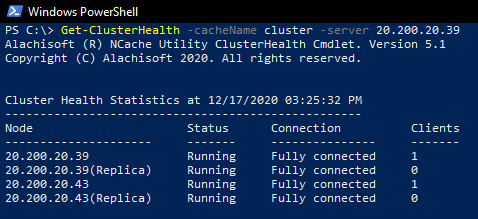
Figure 4: Monitoring cache cluster health with Windows PowerShell
This figure shows how you can monitor your cache server statistics with Windows PowerShell.
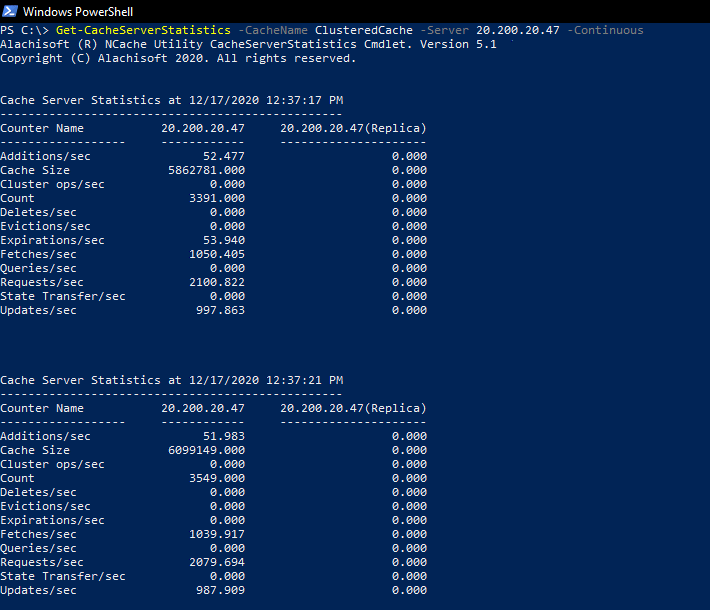
Figure 5: Monitoring cache server statistics with Windows PowerShell
Cache Counters NCache PowerShell Tool Monitor Caches
Monitoring Performance Counters through Prometheus and Grafana
NCache provides multiple ways to monitor your cache clusters. You can monitor cache servers, client servers, and bridge caches through the counters published by NCache. To monitor your stats on a single platform, NCache provides support for the following feature-rich tools:
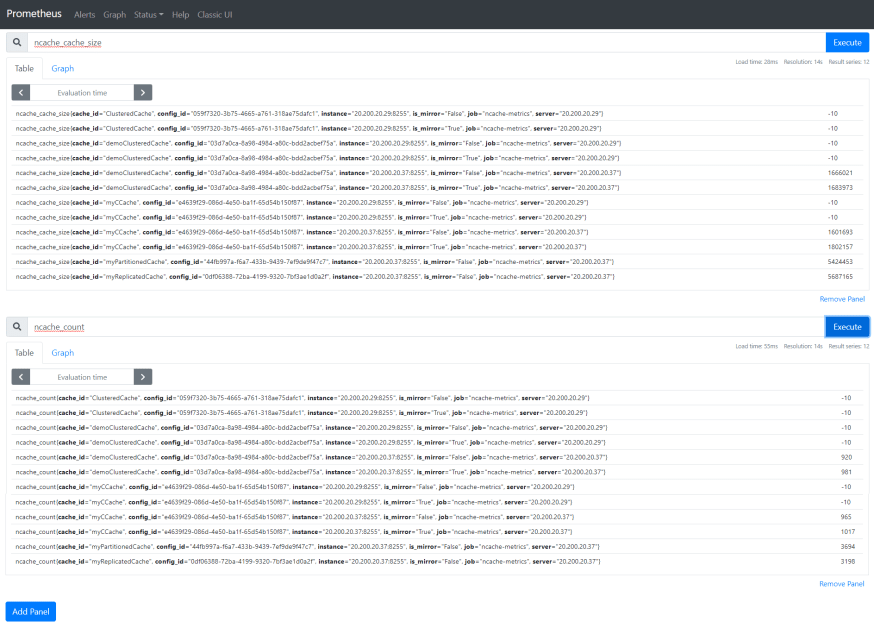
Prometheus for data storage: Prometheus is an open-source metric collection and storage tool that enables you to collect and view the accumulative collective cache statistics in a user-friendly manner. You can search for the counters that you want to monitor from the search bar and execute the query to add them to the panel. Prometheus will fetch all the instances of that counter from all the targets specified in the yml file.
Shown below are multiple cache counters being displayed along with multiple panels.
NCache Details Monitoring with Prometheus Monitoring with Grafana
Monitoring with Grafana: Grafana is a multi-platform open-source monitoring GUI tool which uses the Prometheus server as its data source to pull all the metrics and then collects and displays those metrics data from the NCache cluster. NCache supports the integration with the Grafana GUI application that collects and displays metrics data from your NCache cache cluster. To use Grafana, you have to configure monitoring of NCache using Prometheus as Grafana collects metrics published on the Prometheus server.
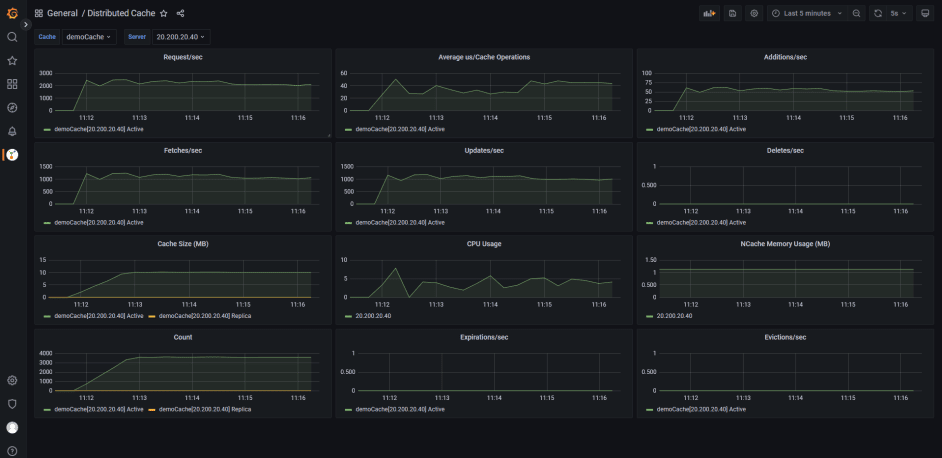
Figure: 7 Distributed Cache Grafana
NCache Details Monitoring with Prometheus Monitoring with Grafana
Monitor NCache using SNMP Counters
SNMP, short for Simple Network Management Protocol is a lightweight protocol and requires minimum prerequisites to be used along with NCache without any hassle. Simply add the MIB files shipped with NCache to any browsing tool you want and start monitoring your counters as early as possible. For a detailed understanding of these files, visit the SNMP Monitoring Docs. Along with the addition of the MIB files, you can now monitor any of the NCache counters easily through SNMP protocol as demonstrated below:
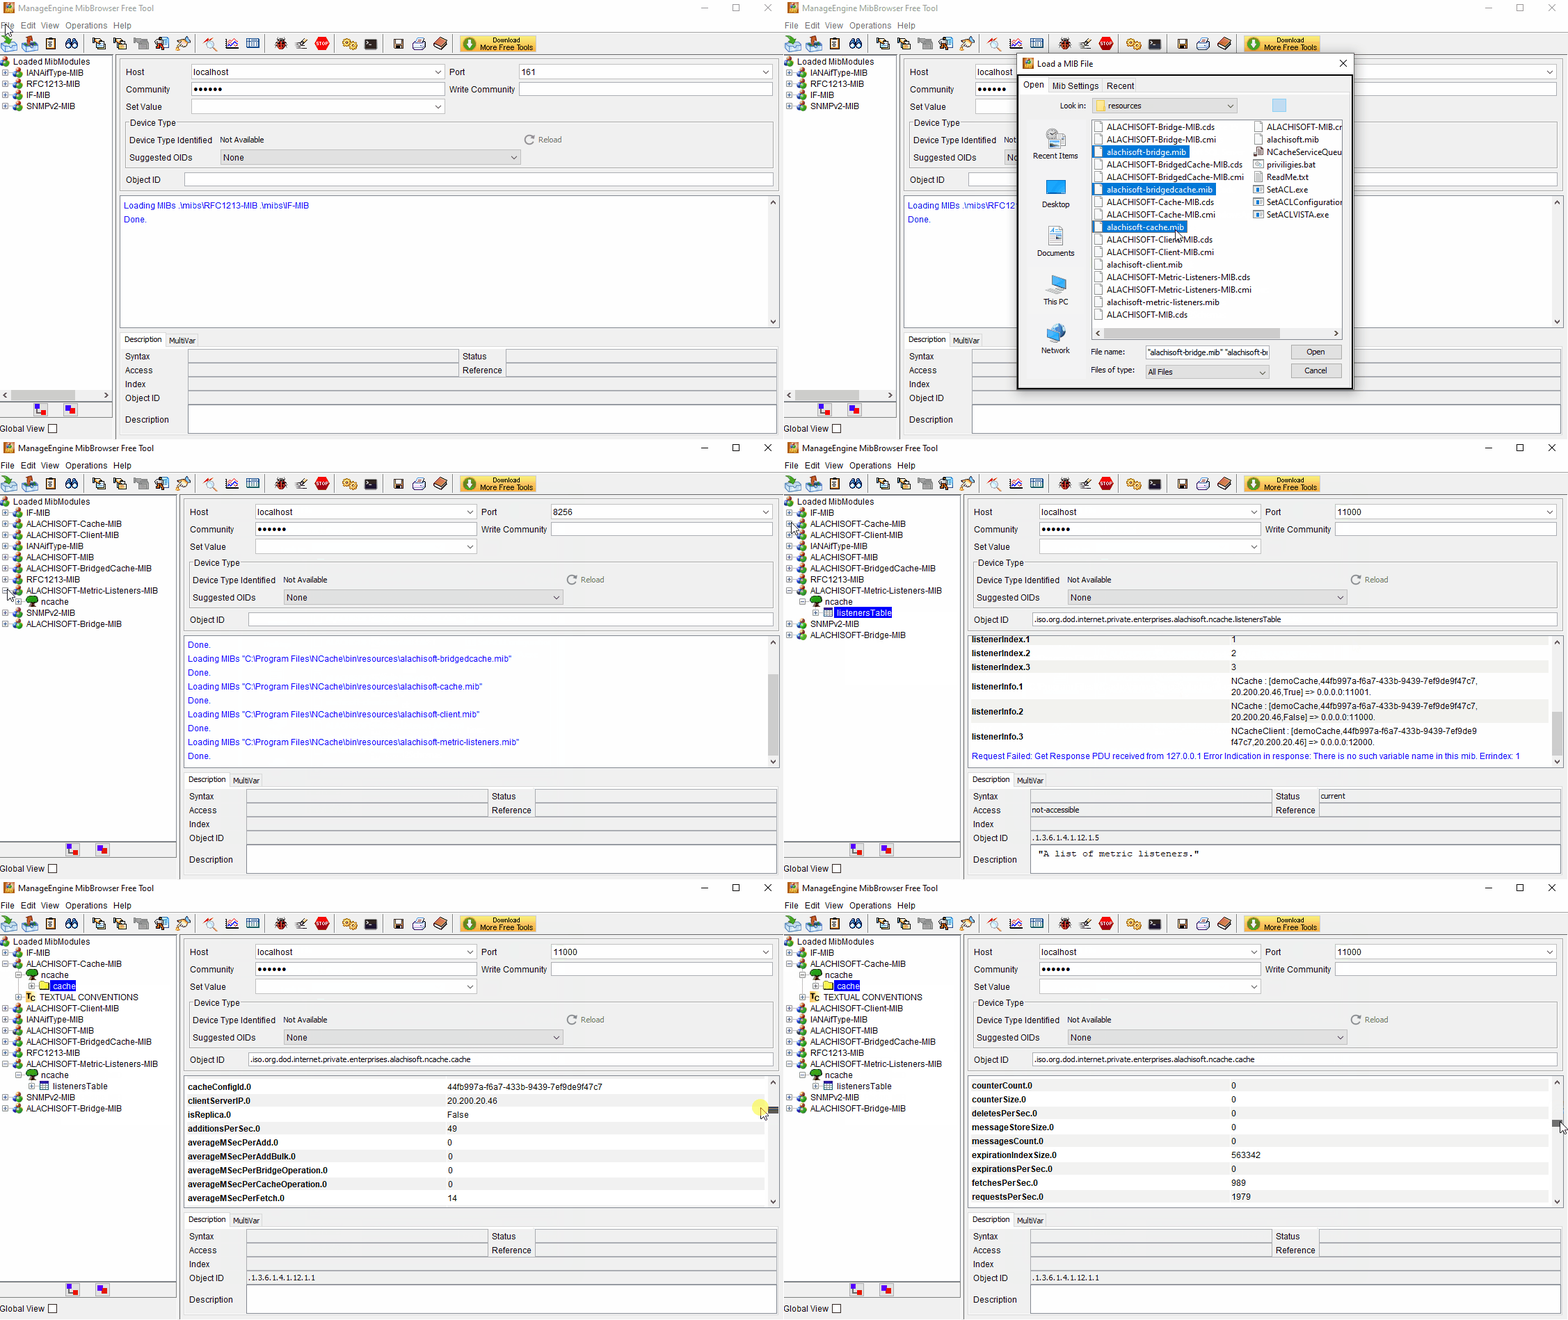
Figure: 8 Monitor Counters through SNMP Protocol
NCache Details SNMP Monitoring Monitor Caches
Conclusion
NCache makes it very convenient and easy to monitor your cache clusters with Multiple Cache Clustering monitoring ways such as Web Monitor, Windows PowerShell, PerfMon Tool, Prometheus, Grafana, and SNMP. Remote monitoring is an essential need of the 21st century because it makes everything fast and easy. This becomes even more evident with the everyday increase in the usage of cloud-based technologies where resources are present in remote locations.
NCache Details Edition Comparison Download NCache

