Let’s assume that you have an e-commerce website that uses NCache as a distributed cache for faster performance and linear scalability. To keep an eye on the performance, NCache provides the support for native monitoring tools like PerfMon on Windows. Since Linux now also supports .NET along with the usage of NCache, therefore the need for a native protocol for monitoring NCache counters over the Linux environment becomes necessary.
NCache an in-memory and linearly distributed cache supports SNMP monitoring of its counters for both Windows and Linux environments in an easy and user-friendly manner.
SNMP: Protocol to Monitor NCache
SNMP, short for Simple Network Management Protocol, is considered to be a standard internet protocol through which different devices on a network communicate and share information. It exposes management data in the form of variables on the managed systems organized in a management information base (MIB), which describes the system status and configuration.
SNMP is a lightweight protocol and requires minimum pre-requisites to be used along with NCache without any hassle. Simply add the MIB files shipped with NCache to any browsing tool you want and start monitoring your counters as early as possible.
NCache Details SNMP Monitoring Monitor Caches
How to Monitor NCache Using SNMP
NCache supports the native protocol SNMP for monitoring your cache and other counters. Before moving towards how to configure SNMP with NCache, let us look at some of its components that need to be known.
- Manager: An SNMP manager is the network management system (NMS) that is responsible for communicating with the SNMP devices on the network. It generates commands and receives responses from the SNMP agents on the device.
- Agent: An SNMP agent receives SNMP requests for information and responds to the manager, and/or gets commands to perform an action.
- MIB Files: This is short for Management Information Base and is a key component of SNMP. It is a text file where SNMP network elements are described as a list of data objects. MIB acts as a dictionary of the SNMP language where every object that is referred in an SNMP message must be listed.
To configure SNMP with NCache, the following steps should be taken accordingly.
Step:1 Pre-requisites
SNMP requires minimum pre-requisites to be followed for it to configure with NCache.
- SNMP is enabled by default on Linux but if you are working on Windows then you have to enable it accordingly.
- NCache service must be running.
- The cache you wish to monitor must be up and running.
Step:2 Configure NCache Service Config
The Alachisoft.NCache.Service.dll.config config file shipped with NCache at %NCHOME%/bin/resources allows you to enable and disable cache counter monitoring via SNMP through the configurable tags that are given below:
For counter monitoring requests, every cache and client listen on separate ports and the default SNMP listener contains information regarding all other listeners. For a thorough understanding of these tags, refer to SNMP Monitoring Docs.
Step:3 Addition of MIB Files
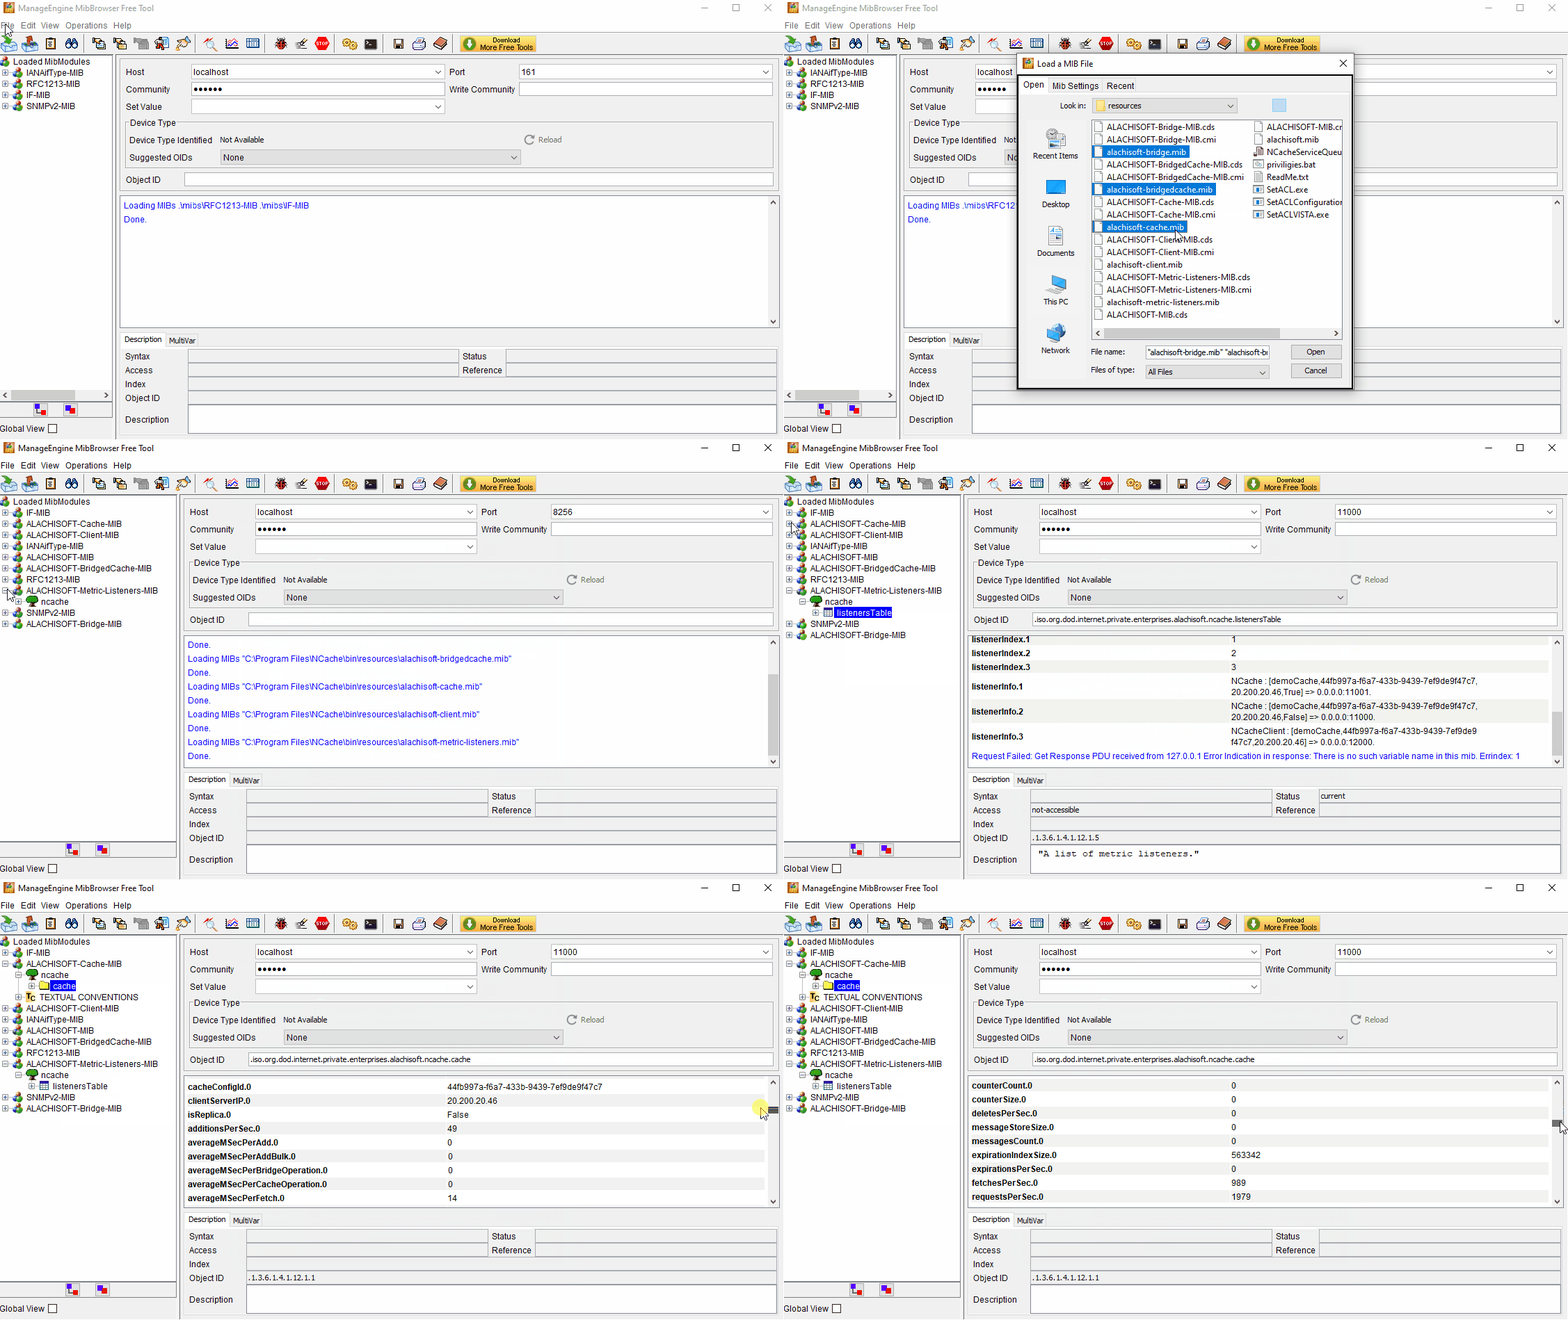
NCache provides MIB files for the counters which can be monitored with SNMP. These files are shipped with NCache at %NCHOME%/bin/resources from where they are added to any tool you choose to browse with. For example, you can use ManageEngine MibBrowser Free Tool. The MIB files are as follows:
- alachisoft-cache.mib file is used for monitoring cache counters.
- alachisoft-client.mib file is used for monitoring cache client counters.
- alachisoft-bridge.mib file is used for monitoring bridge counters.
- alachisoft-bridgedcache.mib file is used for monitoring bridge cache counters.
- alachisoft-metric-listeners.mib is the main file for SNMP monitoring.
For a detailed understanding of these files, visit the SNMP Monitoring Docs. Along with the addition of the MIB files, you can now monitor any of the NCache counters easily through SNMP protocol as demonstrated below:

Figure:1 Monitor Counters through SNMP Protocol
Other Tools for Monitoring NCache
You can monitor cache servers, client servers, and bridge caches through the counters published in NCache. For this purpose, NCache provides multiple other ways to monitor your cache clusters which can be through NCache Web Manager, Prometheus, and Grafana.
Prometheus is an open-source metrics collection and storage tool that enables you to collect and view the accumulative cache statistics in a user-friendly manner. As for Grafana, it is a multi-platform open-source monitoring GUI tool which uses Prometheus server as its data source to pull all the metrics and then displays those metrics data from the NCache cluster. NCache Web Manager is a web-based management tool to configure your caches and view their statistics. Similarly, NCache Web Monitor is a web-based monitoring tool that gives real-time assessment of how your distributed caches and remote clients are performing.
NCache Details Monitoring with Prometheus Monitoring with Grafana
Summing it Up…
NCache is a feature-rich, in-memory, and linearly distributed key-value data store that gives faster response time and best performance. Hence, when your cache clusters are running in a high transaction production environment, it is essential to monitor the nodes, cluster, and client connections. Therefore, NCache supports SNMP Monitoring to make you monitor your cluster environment as conveniently as possible.


