Monitor with NCache Monitor Built-In Dashboard
Note
This feature is not available in .NET Core based installation.
Monitor Cache Server Counters
There are two major categories of performance counters; Server counters and Client counters.
Launch NCache Monitor using NCache Manager:
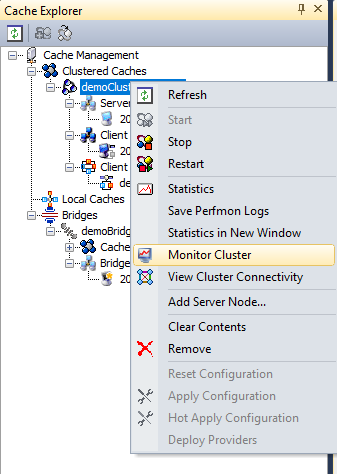
Right click on the clustered cache name under Clustered Cached tree node in Cache Explorer context menu.

Select Monitor Cluster option from the right click menu.
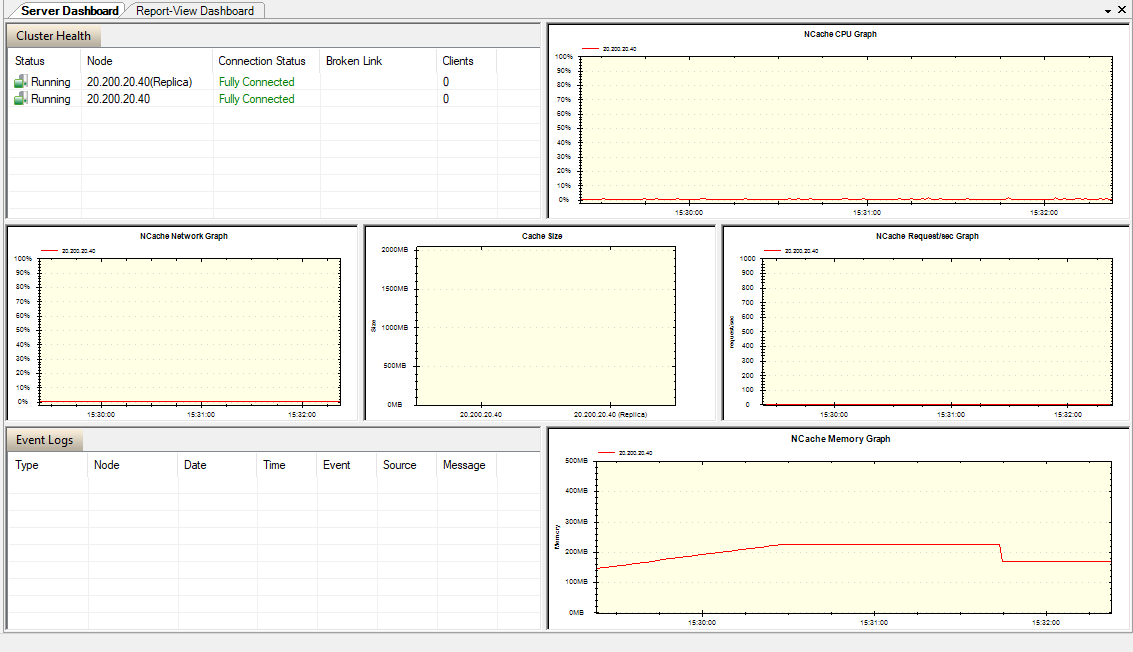
NCache Monitor is opened. By default, there are two dashboards already opened, Server Dashboard and Report-View Dashboard.
Important
Both default dashboards are non-editable. It means no counter or graph can be added or removed from default dashboards.
Server Dashboard

It contains Cluster Health, Event Logs along with some mostly required cache counter graphs like, NCache CPU Graph, NCache Network Graph, Cache Size, NCache Request/sec Graph and NCache Memory Graph etc. Server Dashboard is generally a graphical view dashboard.
Report-View Dashboard

This view shows counters in numeric form rather than graphs. It contains two portions, each for Server Report View and Client Report View. Both portions contain respective counters.
Monitor Cache Client Counters
NCache Monitor also provides built-in dashboard named as Client Dashboard. This dashboard has all required counters/graph in it for the clients’ performance monitoring. It can be viewed for monitoring as follows:
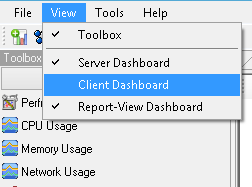
Click on the View menu of the NCache Monitor and click on the Client Dashboard menu option.

Client Dashboard appears and it consists of different client side graphs.

This built-in dashboard displays different client side counters. Few of the counters display the NCache client system resource usage info like NCache Client CPU, NCache Client Memory, NCache Client Network. This dashboard also shows the NCache client specific information, e.g., NCache Client Request Queue, NCache Client Read Operations/sec, NCache Client Write Operations.
It also shows the ASP.NET session counters like ASP.NET Requests/sec, ASP.NET Pending Queue/sec, ASP.NET Total Sessions.
See Also
Monitor with Custom Dashboard
Monitor Cluster Connectivity
Monitor Caches using NCache Manager
Monitor Cluster Connectivity