Monitor Cache Using Prometheus
Note
This feature is only available in NCache Enterprise Edition
NCache offers multiple ways to monitor your cache clusters. You can monitor cache servers, client, bridge, and bridge caches through the extensive counters published by NCache. These counters allow you to monitor individual cache status and other stats of your cache on a single platform.
To provide a solution for this issue, NCache provides support of Prometheus open source stamp-based tool that allows publishing of collective stats on one platform.
Monitoring NCache using the Prometheus tool has three components:
Metrics Publisher: Metrics publisher is responsible for fetching and collecting stats from all metric sources e.g cache servers, client, bridge, and bridge caches. These metrics are exposed at node level. After a certain time interval, it publishes the collected metrics on NCache service. The default value of this interval is 1 second.
Prometheus Agent: On each node, Prometheus agent or metrics agent is used to fetch metrics from NCache service. If you have enabled metrics publishing, then you can view metrics details of a node that has NCache service running on it using its IP and the default port on which the agent runs like this
20.200.20.37:8255. This port is configurable through NCache service config, see configure NCache service config.Prometheus Server: Prometheus server provides a platform to view accumulative cache and bridge stats in a user friendly manner. You can download this Prometheus server from prometheus.io. The Prometheus server runs on the
9090port. You can run this server on any node using its IP address like20.200.20.37:9090. The server comes shipped with a configuration yml file which is used to set the targets (agents) before you run the server.
This chapter provides a step-by-step detailed guide on how to monitor NCache using Prometheus.
Enable Prometheus Monitoring
To configure monitoring using Prometheus, follow these steps:
Configure NCache Service Config
The Alachisoft.NCache.Service.exe.config (.NET)/Alachisoft.NCache.Service.dll.config (.NET Core) config file shipped at %NCHOME%\bin\service allows you to enable/disable monitoring of your caches on Prometheus through configurable tags. These tags are:
<add key="NCacheServer.EnableMetricsPublishing" value="false"/>
<add key="NCacheServer.EnablePrometheusMonitoring" value="false"/>
<add key="NCacheServer.MetricServerPort" value="8255"/>
<add key="NCacheServer.EnableSystemCountersMonitoring" value="false"/>
The
NCacheServer.EnableMetricsPublishingtag is used to enable metrics publishing to NCache service. By default, this tag is set tofalse. You can enable metrics publishing by setting this tag's value astrue.The
NCacheServer.EnablePrometheusMonitoringtag is used to enable monitoring stats on Prometheus agent. This tag is set tofalseby default. Set its value totrueif you want to enable this feature.The
NCacheServer.MetricsServerPorttag is used to configure the port where the prometheus-agent runs. By default, the port is8255but you can configure it as per your need.The
NCacheServer.EnableSystemCountersMonitoringtag is used to enable or disable the monitoring of system counters. By default, this tag is set tofalse.
Note
Save the config file and restart the NCache service and cache host process for the changes to take effect.
Configure Prometheus Config File
The second step of monitoring NCache using Prometheus is to populate prometheus.yml file that is shipped with the Prometheus server.
Open the
prometheus.ymlfile in an editor.Set the
scrape_intervalas per your requirement. This interval is the time after which the Prometheus server pulls metrics from Prometheus agent.Set the
job_nameto a value containing the keyword "NCache" to distinguish multiple targets.Set your agent's address as the
targetsvalue. The port should be the same as the one mentioned in theAlachisoft.NCache.Service.dll.configfile. Your changes will look like this:
scrape_configs:
  - job_name: 'ncache-metrics'
    static_configs:
    - targets: ['20.200.20.37:8255','20.200.20.29:8255']
- Save the yml file.
Run Prometheus Application for Cache Monitoring
Important
Update the prometheus.yml file before running the server. In case Prometheus server was already running when you updated the yml file, you need to restart the Prometheus server. Any change in the prometheus.yml file requires you to restart Prometheus server.
Go to the folder where you extracted the Prometheus setup and run
prometheus.exe. If you see the "Server is ready to receive web requests." message on the command prompt, it means your Prometheus server is ready to make calls to your Prometheus agent.Open a web browser of your choice and add the IP of the node where you want the Prometheus server to run along with the default Prometheus server port i.e 9090 in the address bar of the browser. For example, if I want the Prometheus server to run on IP
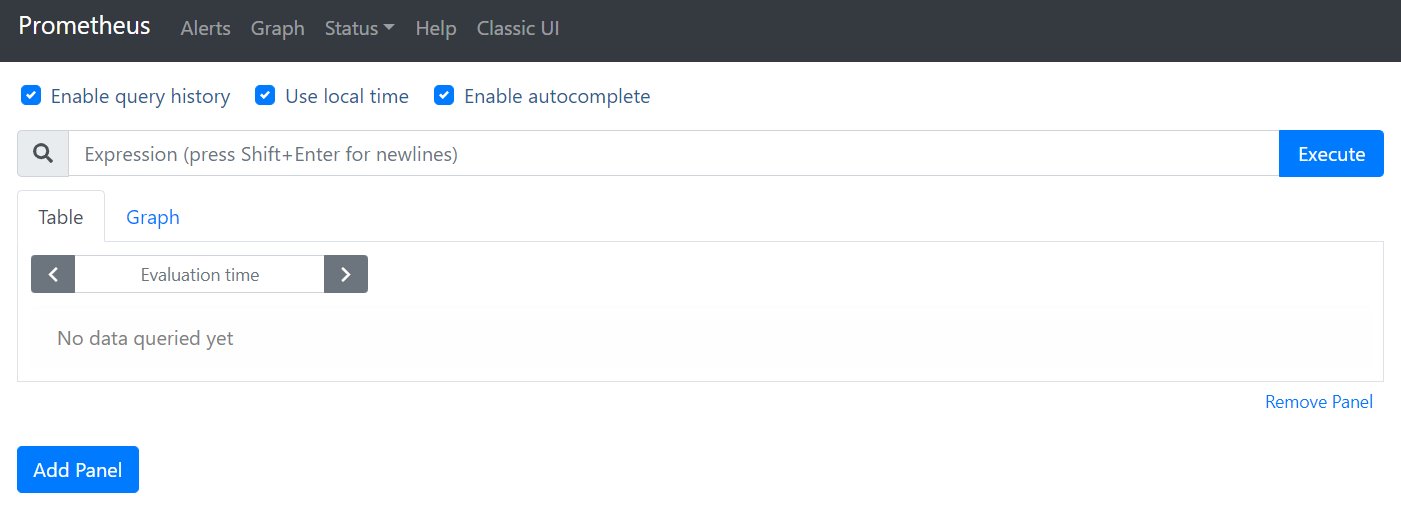
20.200.20.37, I would request for20.200.20.37:9090in the address bar.This will open the Prometheus server on your machine.

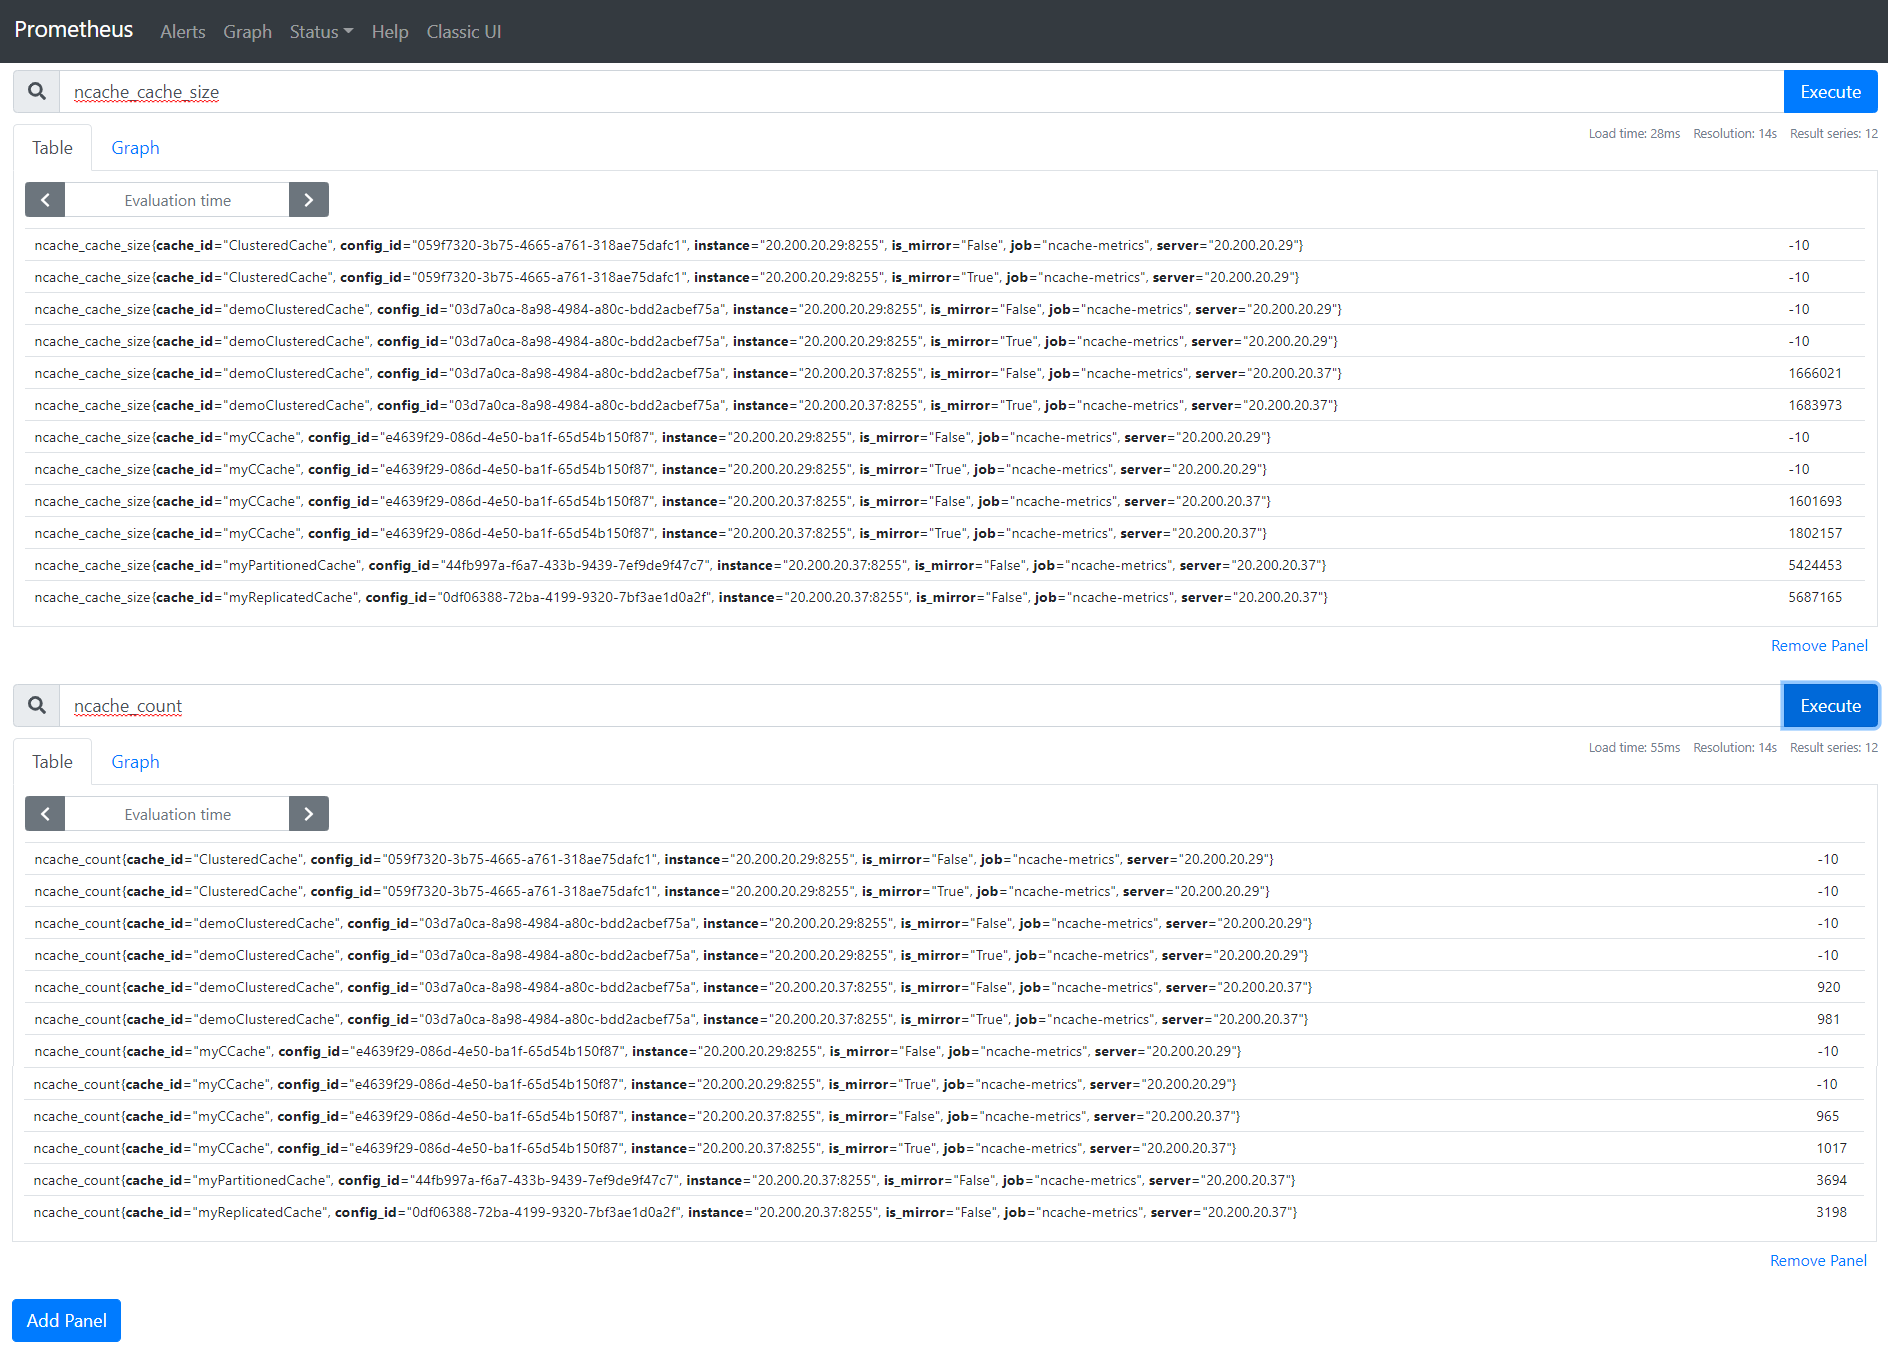
- In the search bar, search for the counter you want to monitor. This will fetch all instances of that counter from all targets specified in the config file. Go to NCache Counters to see all server, client, bridge, and bridge cache counters supported in NCache.

Note
If the counter you want to monitor is not listed among the counters shown on Prometheus, it is most likely that its publishing has been turned off by default. To enable publishing of the counters that you want to monitor, you can use the monitoring.ncconf file shipped with NCache at %NCHOME%\config for Windows and /opt/ncache/config for Linux. Refer to Monitoring Config to understand how to configure this file according to your requirements. Please note that only the counters whose publishing has been set to true will be published on Prometheus agent and server. After configuring monitoring.ncconf, restart NCache service.
- You can add panels to view multiple counters at the same time as follows:

Troubleshooting
In case you encounter any issue with the Prometheus agent, go to MetricServer logs found at %NCHOME%/log-files.
See Also
Monitor NCache using Windows PerfMon Tool
Monitor Caches using NCache Web Manager
Monitor Caches using NCache Web Monitor
Logging